The peak shaving Philippines pitch usually arrives before anyone has looked at your load data.
It is a good pitch. Demand charges are billed on the single highest power draw your site records in a billing period, so a battery that flattens one short spike cuts a line on the bill without changing how much energy you use. The arithmetic is genuinely attractive.
It is also, on most Philippine sites we monitor, about a third of the real case. This piece works through an actual 24-hour profile from one of our commercial installations to show what a battery would and would not have done there, and where the money actually was.

Peak shaving is the use of battery storage to reduce the highest power draw a site records in a billing period, because demand charges are billed on that peak in kW rather than on total consumption in kWh. Philippine commercial and industrial demand charges run roughly PHP 500 to PHP 1,000 per kW per month including VAT depending on the utility, so removing 100 kW is worth PHP 600,000 to PHP 1,200,000 a year. On sites with a high load factor, however, demand charge savings are often no larger than the value of storing exported solar and riding through outages, and a proper assessment counts all three.
Demand charges behave differently to everything else on the bill
Energy charges are cumulative. Run a motor twice as long, pay twice as much.

Demand charges are not. They are billed on the single highest power draw in the period, averaged over a short interval, usually fifteen minutes. Hit that peak once, on one afternoon, and it sets the charge for the whole month. The other 2,975 intervals do not matter to that line.
Which is why two factories consuming identical energy get very different bills. One runs smoothly. The other starts three large motors together at shift change and pays for the habit every month.
What storage can and cannot touch
| Bill component | Billed on | Can a battery reduce it |
| Generation charge | Energy consumed in kWh | Indirectly. A battery shifts energy rather than producing it, so savings come from paired solar or from charging in cheaper periods where the tariff allows |
| Demand charge | Highest recorded kW in the period | Yes. This is the direct target |
| Distribution charges tied to demand | Highest recorded kW | Yes, on the demand-linked portion |
| Fixed metering and supply charges | Per customer, per month | No |
| Universal charges and taxes on energy | Per kWh consumed | Proportionally, only as far as kWh falls |
| Power factor adjustment | Measured power factor | Sometimes. Some hybrid inverters provide reactive support, but confirm rather than assume |
The demand charge arithmetic
Find your demand charge on the bill, decide how much peak you could realistically remove, and read across. All figures annual, calculated as kW multiplied by the monthly rate multiplied by twelve.

| Peak reduction | At PHP 500 per kW | At PHP 750 per kW | At PHP 1,000 per kW |
| 20 kW | PHP 120,000 | PHP 180,000 | PHP 240,000 |
| 50 kW | PHP 300,000 | PHP 450,000 | PHP 600,000 |
| 100 kW | PHP 600,000 | PHP 900,000 | PHP 1,200,000 |
| 200 kW | PHP 1,200,000 | PHP 1,800,000 | PHP 2,400,000 |
| 500 kW | PHP 3,000,000 | PHP 4,500,000 | PHP 6,000,000 |
The tariff you sit under changes the answer by a factor of two. A project that fails at PHP 500 per kW can be comfortable at PHP 1,000, with identical equipment on an identical load. Which utility serves your site is a larger variable than most of the engineering.
But the left-hand column decides the project, and it is set by the shape of your load rather than by anything a supplier can sell you.
A real profile, from a real site
Below is a monitored 24-hour energy balance from one of our commercial installations. The client is anonymized. Everything else is exactly as the portal reported it.
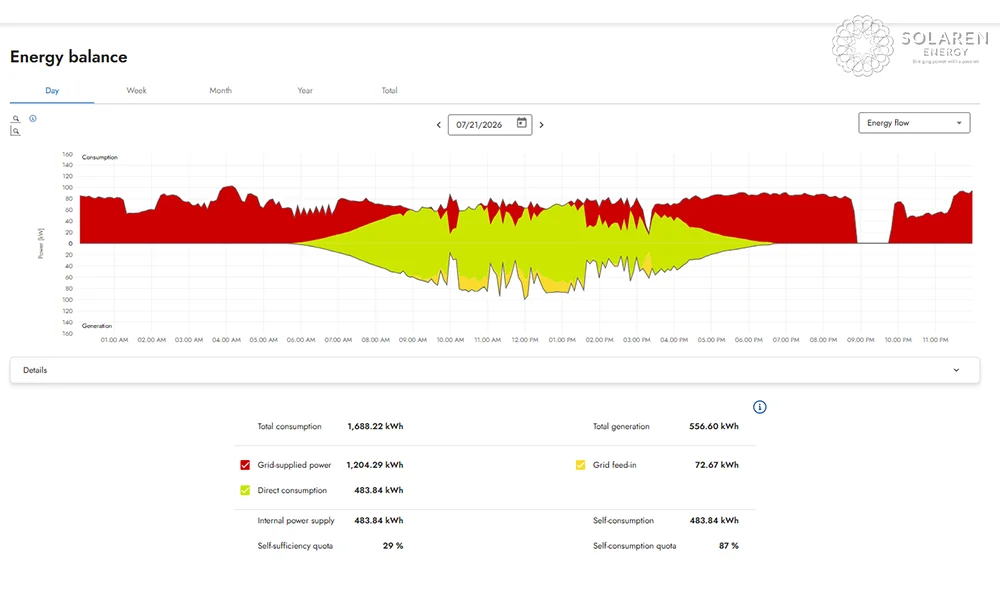
Caption: Monitored energy balance for a single day. Red is consumption drawn from the grid, yellow is on-site solar generation. The brief flat section shortly after 21:00 is a grid outage.
Here is what the portal reported for that day.
| Measure | Value | What it tells you |
| Total consumption | 1,688 kWh | Average load of about 70 kW across the day |
| Total generation | 557 kWh | Solar covering a meaningful share, but never the whole site |
| Grid supplied | 1,204 kWh | Most of the day is still bought in |
| Direct consumption | 484 kWh | Solar used on site the moment it was produced |
| Grid feed-in | 73 kWh | Surplus that went out to the grid instead of being used |
| Self sufficiency | 29 percent | Under a third of demand met from own generation |
| Self consumption | 87 percent | Most generation used on site, but not all of it |
Three separate things are visible in that chart, and only one of them is peak shaving.
One: the peak shaving case here is modest
Average load is about 70 kW. The peaks sit near 100 kW. That is a load factor around two-thirds, which describes a reasonably smooth industrial profile with texture rather than dramatic spikes.

The gap between average and peak is roughly 30 kW. Realistically you might remove 20 to 30 kW of it, which on the table above is worth somewhere between PHP 120,000 and PHP 360,000 a year depending on the tariff. Real money. Not on its own a reason to buy a battery system.
This is the part of the pitch that gets oversold. A site needs somewhere to fall for peak shaving to be transformative, and a flat load has nowhere to fall. If your profile is close to a straight line, the demand charge case is small and any consultant claiming otherwise has not looked at your data.
We would rather establish that before a proposal than after one.
Two: the exported solar is worth as much as the peak
Look at the grid feed-in figure. 73 kWh went out to the grid that day, and self-consumption sits at 87% rather than 100%. For part of the middle of the day this site generated more than it could use.
Under net metering that surplus is credited at the generation charge, not at what you pay for power. So the site exports at roughly PHP 5.50 and buys the same energy back a few hours later at something closer to PHP 12.43. Every exported kilowatt hour is a small loss dressed as a credit.
A battery captures it instead. Here is the working, at 73 kWh a day and roughly 90% round-trip efficiency:
| Without battery | With battery | |
| Surplus solar per year | 26,500 kWh | 26,500 kWh |
| Exported for credit at about PHP 5.50 | PHP 145,900 | Nil |
| Delivered back to site after round trip losses | Nil | 23,900 kWh |
| Retail purchase avoided at about PHP 12.43 | Nil | PHP 296,700 |
| Net annual value | PHP 145,900 | PHP 296,700 |
| Gain from storing rather than exporting | PHP 150,800 |
Roughly PHP 151,000 a year, from about 90 kWh of nameplate capacity at 80% depth of discharge. Comparable to the entire demand charge case, from a mechanism nobody raised in the sales conversation.
Two caveats stated plainly. This is one day annualized, which is crude, and a full year of data would move the number. And the export credit rate is the assumption doing the heavy lifting, so check it against an actual bill before anyone builds a model on it.
Three: the outage is right there in the data
Shortly after nine in the evening the trace drops to nothing and stays there before recovering.
That is a grid outage. Not a meter fault, not a planned shutdown. One interruption, captured in one ordinary day of monitoring, on a site that was not being watched for reliability at all.

Worth pausing on, because outages are the value stream that never appears in a storage spreadsheet. Nobody can put a peso figure on it without knowing what an hour of stopped production costs you, and that number lives with your operations people rather than with us.
What the chart does establish is frequency. If a single arbitrary day contains an interruption, the annual count is not small. A battery bought for demand charges and solar shifting rides through those events at no additional capital cost, which makes continuity the cheapest of the three benefits and the one most often left out of the justification. The wider picture is in grid instability and how solar reduces business power risk.
Stacking the three
This is how a storage case should be presented, and almost never is.
| Value stream | What the data shows | Annual value | What it requires |
| Demand charge reduction | About 30 kW between average and peak | PHP 120,000 to 360,000 | 20 to 30 kW discharge, modest energy capacity |
| Storing exported solar | 73 kWh exported in one day, 87% self-consumption | About PHP 151,000 | Around 90 kWh nameplate at 80% depth of discharge |
| Outage ride through | One interruption in a single monitored day | Not quantified. Depends on cost of downtime | Enough kW to carry the critical load |
| Combined quantified value | PHP 271,000 to 511,000 | Roughly 100 kW and 90 to 100 kWh |
No single line justifies the system. Together they might, and the continuity benefit is not even in the total.
That is the honest shape of most Philippine commercial storage projects. Anyone selling you on demand charges alone is either working from a genuinely spiky load or has not read your data.
Sizing, and the difference between kW and kWh
Two numbers, two jobs. Confusing them is the most common sizing error on quotations written by other people.
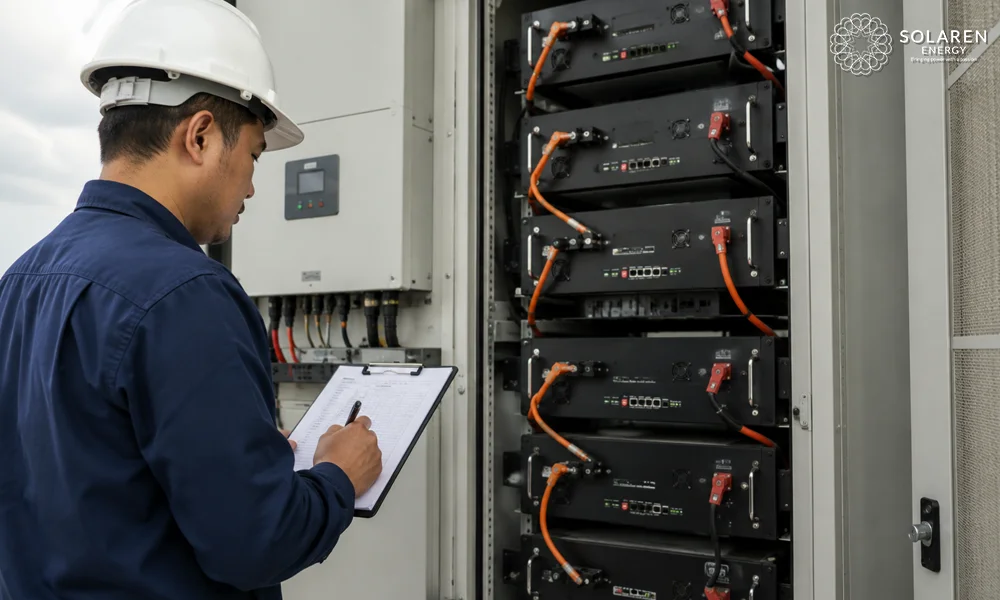
The kW rating decides how much load you can carry at once. The kWh rating decides how long you can hold it there.
| Job to cover | Usable energy needed | At 80% depth of discharge | Nameplate to specify |
| 30 minutes at 30 kW | 15 kWh | 19 kWh | Around 20 kWh |
| 1 hour at 30 kW | 30 kWh | 38 kWh | Around 40 kWh |
| Full daily solar surplus | 73 kWh | 91 kWh | Around 90 kWh |
| 4 hours at 100 kW | 400 kWh | 500 kWh | Around 500 kWh |
On the site above, the demand charge job needs about 20 kWh and the solar shifting job needs about 90. Size for the larger and the smaller comes free, which is exactly why the two cases belong in one assessment rather than two.
Check the power rating carefully too: whether the quoted figure is continuous or peak, if peak, then for how many seconds, and whether continuous was measured at 25C in a laboratory or at 40C, which is closer to a Philippine plant room.
The Ratchet Clause
Read your supply contract for a demand ratchet before modeling anything.
Some tariffs bill demand not on this month’s peak but on the highest peak across a rolling window, often twelve months, or a percentage of it. Under that structure, one unmanaged spike does not cost you a month. It sets a floor under your bill for a year.
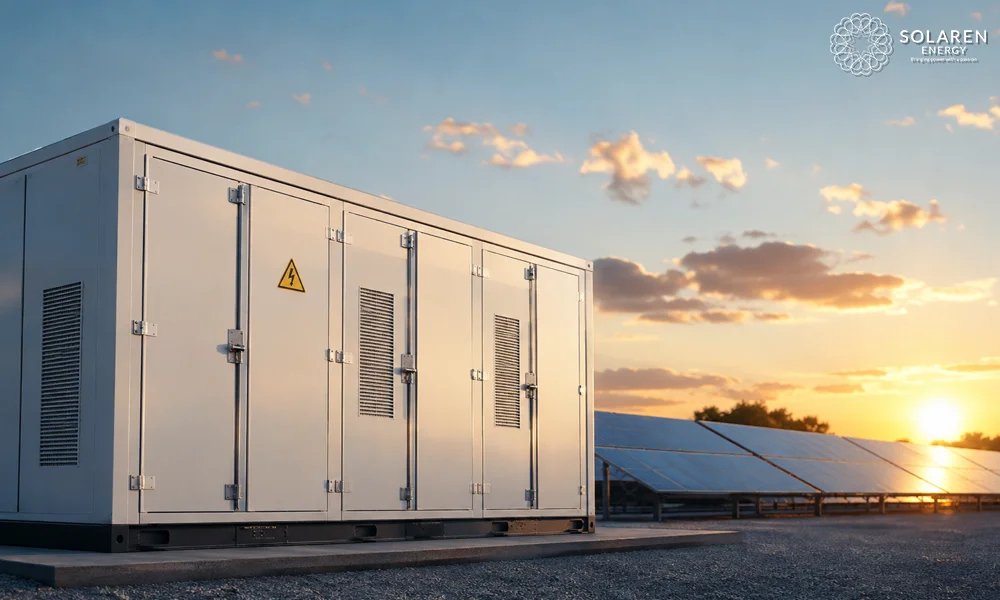
Two consequences. A battery that reliably prevents spikes is worth considerably more than the simple monthly arithmetic suggests. And a battery that misses one spike, because it was undersized or the control response was slow, loses most of a year of value in a single interval. That argues for headroom in the kW rating, a control response measured in seconds, and a system that logs what it did.
What the battery has to survive
Storage doing all three jobs works hard. It discharges at high power in short bursts, absorbs surplus on every clear day, and has to be available when the grid drops.
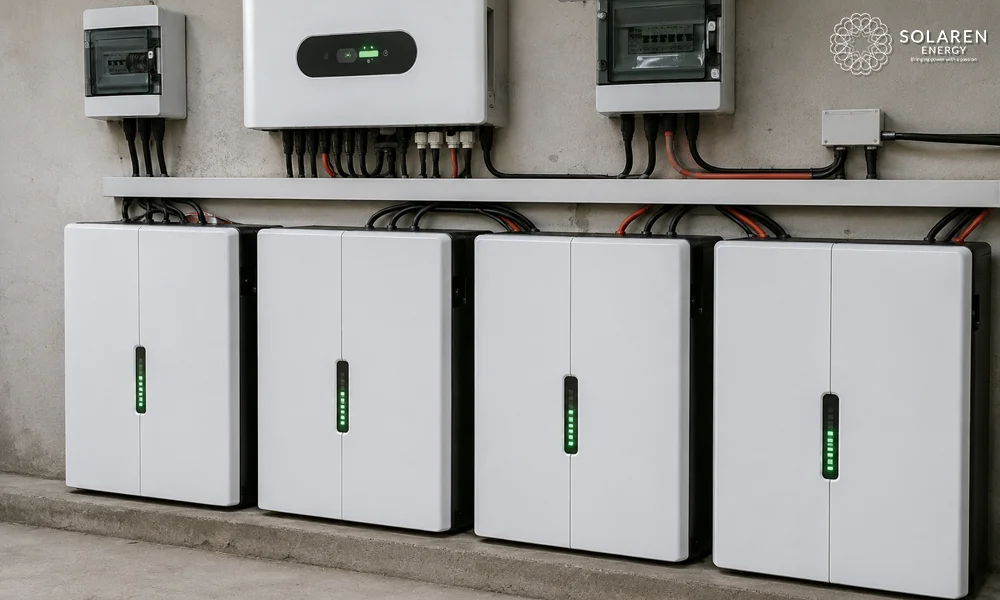
A site cycling twice daily reaches 6,000 cycles in just over eight years, so a ten year calendar warranty may never come into play. Convert every offer into pesos per kWh of guaranteed throughput before comparing, which is worked through in solar battery cycle life and warranty.
High discharge current is also the condition that exposes undersized busbars, weak cell compression and absent thermal management, and whether a spike gets through at all depends on the battery management system and how quickly it responds. Specify on continuous ratings at 40C, not on nameplate figures.
Questions to ask before commissioning a study
- What is our demand charge per kW, including VAT, on our current tariff?
- What is our export credit rate per kWh, and how does it compare to what we pay?
- Does our supply contract contain a demand ratchet, and over what window?
- Can the utility provide interval demand data, and at what resolution?
- What is our load factor, meaning average load divided by peak load?
- How much solar are we exporting in a month, and what is our self-consumption percentage?
- How long do our peak events last, in minutes, and how many occur monthly?
- How many grid interruptions did we record last year, and what did they cost us?
- Are the peaks driven by a process we could reschedule instead of buying hardware for?
- What continuous discharge rating does the pack hold at 40C ambient?
- How fast does the control system respond to a rising load, in seconds?
- Does the system log every peak event, export event and outage, and can we export that log?
Questions 2 and 6 are the ones nobody asks. On the site above, they were worth as much as question 1.
Question 9 is the one an honest supplier raises first. Sometimes the answer is a schedule change rather than hardware, and if nobody puts that on the table you should wonder why.
How we approach these projects
We start with monitored data and a load profile, not with a product. The chart above took one day to produce and it reordered the entire business case for that site.
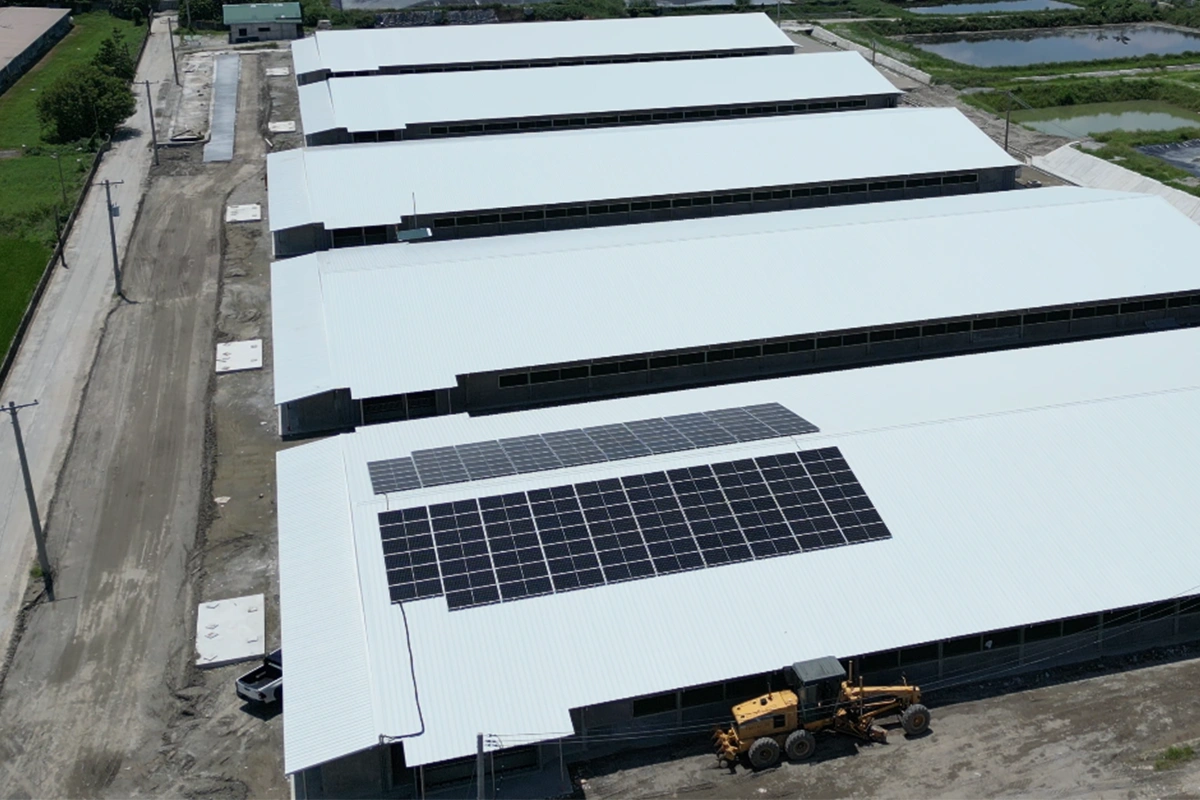
Commercial and industrial storage across our project record includes systems at the Inainakay Foundation and Kings Orchard, and dual-source generation at Rivera Agro Industrial, where solar runs alongside an existing biogas plant and the installation has been expanded as the operation grew. Every one was sized from measured data rather than a rule of thumb.
The wider argument is the one in why cheap solar costs more over time. A peak shaving system that fails to shave a peak has not saved you a smaller amount. It has saved you nothing that month, and under a ratchet it has cost you the year.
Frequently asked questions

What is peak shaving?
It is the use of battery storage to reduce the highest power draw a site records during a billing period. Because demand charges are billed on that single peak in kW rather than on total energy in kWh, removing a short spike can cut the bill without changing how much energy the site uses.
How much are demand charges in the Philippines?
Across the sites we work on, commercial and industrial demand charges fall roughly between PHP 500 and PHP 1,000 per kW per month including VAT, varying by distribution utility and electric cooperative. Removing 100 kW is therefore worth roughly PHP 600,000 to PHP 1,200,000 a year on that line alone.
Does peak shaving work on a site with a flat load?
Poorly. Peak shaving needs a gap between average load and peak load to work with. On one of our monitored commercial sites, average load was about 70 kW against peaks near 100 kW, so the realistic demand charge saving was PHP 120,000 to PHP 360,000 a year. Useful, but on its own not enough to justify a system.
Is it better to store exported solar than to export it?
Usually, under Philippine net metering. Export is credited at the generation charge, around PHP 5.50, while you buy power back at something closer to PHP 12.43. On a site exporting 73 kWh a day, storing that surplus rather than exporting it was worth roughly PHP 151,000 a year after round-trip losses, which matched the entire demand charge case.
What size battery do I need for peak shaving?
The kW rating must cover the peak you want to remove and the kWh rating must sustain it for the duration of the peak. Removing 30 kW for thirty minutes needs only about 20 kWh of nameplate at 80% depth of discharge. Capturing a full day of exported solar on the same site needed about 90 kWh, so the larger job set the size.
What is a demand ratchet?
A tariff clause billing demand on the highest peak recorded over a rolling window, often twelve months, rather than on the current month. Under a ratchet, a single unmanaged spike sets a floor under your bill for the year, which raises the value of reliable peak shaving considerably.
Does a battery help with power outages?
Yes, and it is usually the benefit left out of the justification. Storage installed for demand management and solar shifting rides through interruptions at no additional capital cost. One ordinary monitored day on our example site contained a grid outage shortly after nine in the evening, which suggests the annual count is not small.
Can a battery reduce my generation charge?
Not directly. A battery shifts energy rather than producing it, so reductions in energy charges come from paired solar or from charging during cheaper periods where the tariff allows. The demand charge is the line storage attacks on its own.
The short version
Peak shaving Philippines-wide is an arithmetic exercise, not a technology question, and the arithmetic has three terms rather than one.
Find the demand charge on your bill and the gap between your average and peak load. Find your export credit rate and how much solar you are giving away. Count the interruptions you had last year. Then add the three together, because no serious storage case in this market rests on any one of them.

On the site in this piece, the mechanism everyone talks about was worth about the same as the mechanism nobody mentioned, and the third benefit turned up uninvited in a single day of monitoring. That is what measured data does to a sales conversation. If you want to work back from first principles instead, start with how to choose a solar battery.