Every solar proposal in this country contains a number for expected generation. Almost none of them tell you where that number came from, and very few of the companies quoting it have ever published what their installed systems actually produce. This post does exactly that. It presents real solar panel output in the Philippines from 103 Solaren-installed systems across Luzon, the Visayas, and thirteen provinces, for the full calendar year 2025.
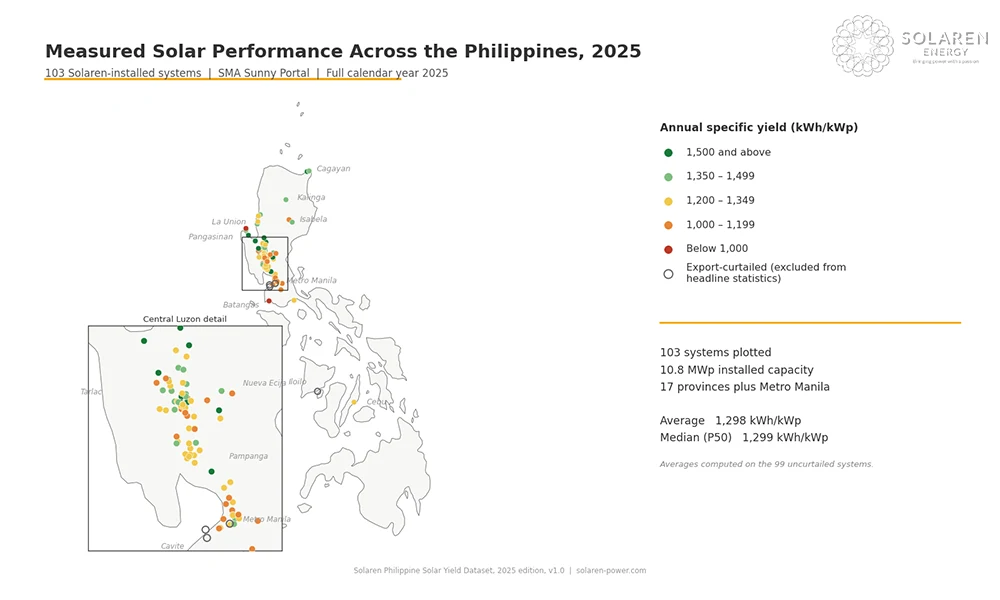
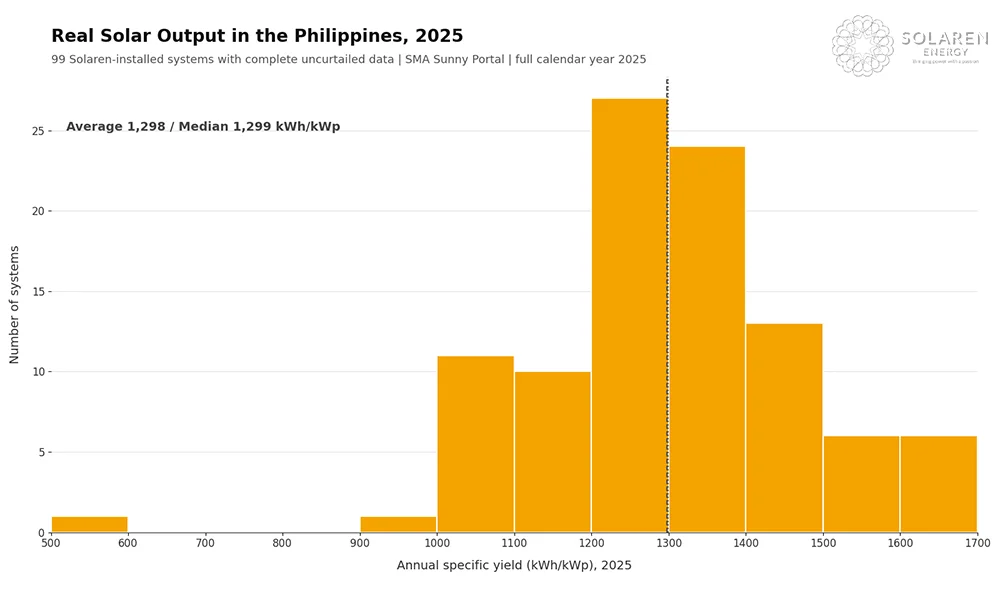
Across 99 Solaren-installed systems with complete, uncurtailed 2025 monitoring data, real solar panel output in the Philippines averaged 1,298 kWh per kWp installed for the year. That is equivalent to about 3.6 peak sun hours per day after all real-world losses. Half of all systems produced between 1,200 and 1,400 kWh/kWp.
These are not simulations. These are meter readings from systems that spent 2025 collecting dust, dodging typhoons, riding through brownouts, and in a few honest cases going uncleaned for years. Some are twelve years old, so panel degradation is baked into the averages rather than hidden by a young fleet. This is what solar actually does in the Philippines, published so that anyone evaluating a quotation has a benchmark that came from roofs instead of brochures.
Where This Data Comes From
The dataset covers 103 systems totaling 10.8 MWp, which represents roughly ten percent of everything Solaren has deployed across 2,500+ installations. These particular systems were included because they met three criteria, and only these criteria:
- One monitoring platform: Every system reports to SMA Sunny Portal, the platform on which bankable performance reports are built. One platform means one measurement methodology across all 103 systems, with no mixing of monitoring standards.
- A complete 2025 record: Twelve uninterrupted months of data, January through December. Systems commissioned mid-year or with data gaps were excluded for completeness, not performance.
- No known export curtailment: Four large curtailed systems are shown separately below rather than mixed into the headline figures.
No system was excluded for performing badly. The worst performer in the entire dataset is printed in the table, with its explanation. That is the difference between a dataset and a highlight reel.
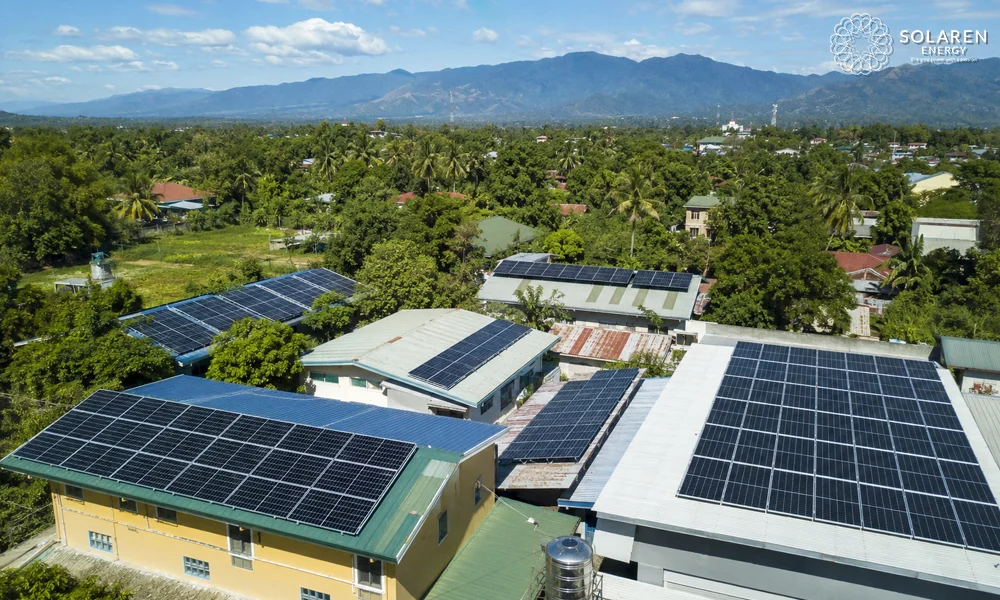
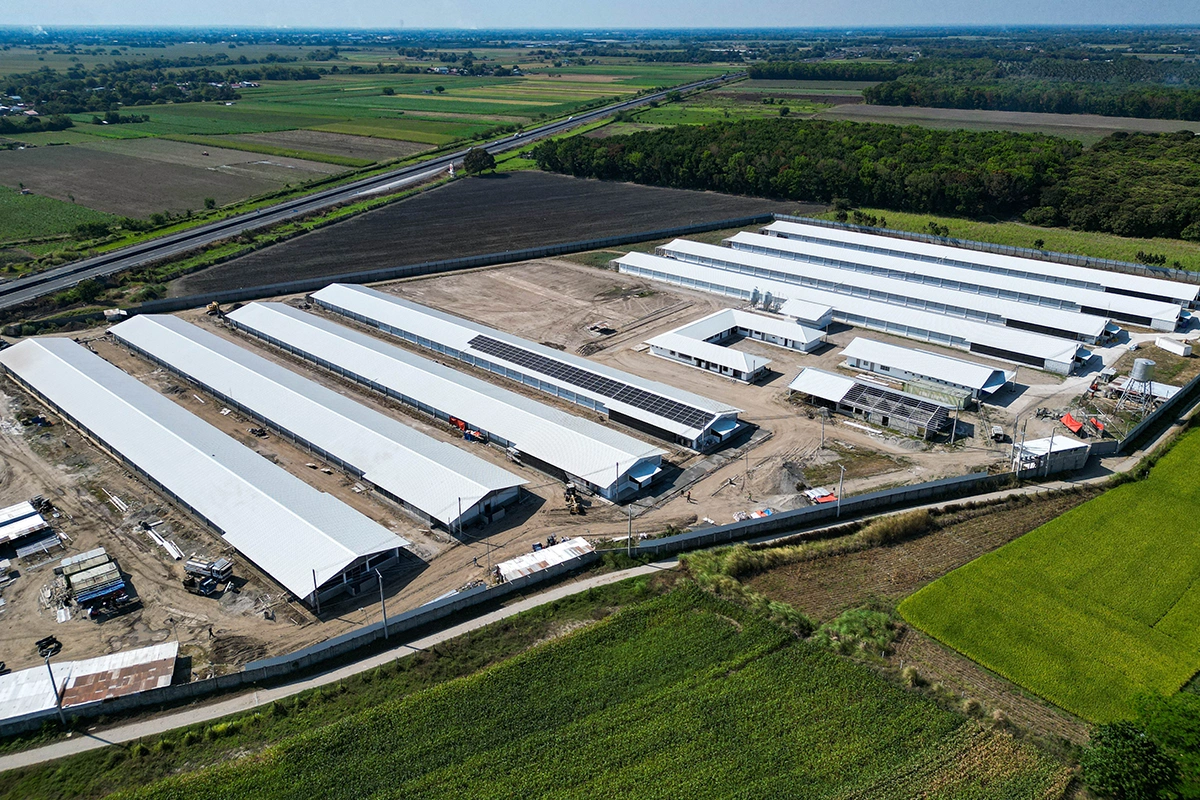
The systems range from 3 kWp homes to a multi-megawatt manufacturing plant: 61 residences, 11 farms, 18 commercial and hospitality buildings, 6 institutional sites, and the industrial book. Geographically, they run from Ilocos Sur and Kalinga in the north to Cebu and Iloilo in the south. Residential and commercial systems are deliberately mixed because the sun does not check the business permit, and because full disclosure is the point.
One statistical note for the careful reader. The headline 1,298 kWh/kWp is a simple per-system average, which weights a small home equally with a factory. Weighted by installed capacity, and excluding the single impaired site explained below, the figure is 1,255 kWh/kWp. The two numbers agree closely, which tells you the result is not an artifact of system size.
The Full 2025 Results
Specific yield is annual generation divided by installed capacity, expressed in kWh per kWp. It is the standard measure that lets a 5 kWp home and a 500 kWp factory be compared on equal terms. Higher is better.
Farms and Agriculture
| Type | Location | 2025 yield (kWh/kWp) |
|---|---|---|
| Poultry farm | Tarlac | 1,632 |
| Dressing plant | Rosales, Pangasinan | 1,603 |
| Farm | Sta Ignacia, Tarlac | 1,436 |
| Farm | Sta Ignacia, Tarlac | 1,430 |
| Farm | Sta Ignacia, Tarlac | 1,412 |
| Hatchery | Sta Ignacia, Tarlac | 1,333 |
| Farm | Sta Ignacia, Tarlac | 1,286 |
| Hog farm | Tanay, Rizal | 1,126 |
| Farm | Sta Ignacia, Tarlac | 1,114 |
| Farm | Sta Ignacia, Tarlac | 1,037 |
| Agro farm | Concepcion, Tarlac | 1,033 |
Commercial, Hospitality and Offices
| Type | Location | 2025 yield (kWh/kWp) |
|---|---|---|
| Hotel (routinely cleaned) | Pampanga | 1,483 |
| Commercial facility | Victoria, Tarlac | 1,438 |
| Commercial building | Tarlac City | 1,399 |
| Resort | San Fernando, La Union | 1,392 |
| Café | Imus, Cavite | 1,346 |
| Commercial building | Mexico, Pampanga | 1,316 |
| Commercial building | Tarlac City | 1,300 |
| Doughnut shop | Sta Maria, Bulacan | 1,271 |
| Retail branch | Paniqui, Tarlac | 1,268 |
| Construction office | Sta Maria, Bulacan | 1,245 |
| Retail branch | Gapan, Nueva Ecija | 1,236 |
| Fuel station complex | La Union | 1,231 |
| Commercial building | Tarlac City | 1,124 |
| Hotel | Santiago City, Isabela | 1,110 |
| Office building (post-construction shading) | Makati City | 1,079 |
| Hotel | Pasay City | 1,073 |
| Commercial flagship | Tarlac City | 1,047 |
| Office building (shaded, urban pollution) | Makati City | 1,020 |
Institutional
| Type | Location | 2025 yield (kWh/kWp) |
|---|---|---|
| Senior high school | Baliwag, Bulacan | 1,509 |
| Municipal building | Moncada, Tarlac | 1,450 |
| Municipal building | Moncada, Tarlac | 1,401 |
| University building | Pampanga | 1,323 |
| University gym | Angeles City | 1,262 |
| College (uncleaned) | Tarlac City | 1,017 |
Industrial
| Type | Location | 2025 yield (kWh/kWp) |
|---|---|---|
| Factory | Tarlac | 1,275 |
| Ice plant | Angeles City | 1,050 |
| Flour mill (closed pre-sale, heavy flour dust; now cleaned and operating) | Calaca, Batangas | 503 |
Residential (61 Systems, 3 to 140 kWp)
| Location | 2025 yield (kWh/kWp) |
|---|---|
| Pando, Tarlac | 1,640 |
| Alaminos, Pangasinan | 1,635 |
| Camiling, Tarlac | 1,623 |
| San Leonardo, Nueva Ecija | 1,602 |
| Dagupan City | 1,600 |
| Binalonan, Pangasinan | 1,583 |
| Sta Ana, Cagayan | 1,583 |
| Tarlac City | 1,569 |
| Tarlac City | 1,540 |
| Tagudin, Ilocos Sur | 1,484 |
| Tabuk, Kalinga | 1,460 |
| San Jose, Tarlac | 1,459 |
| Tarlac City | 1,422 |
| Sta Ana, Cagayan | 1,422 |
| Tarlac City | 1,400 |
| Tarlac City | 1,391 |
| Santiago City, Isabela | 1,390 |
| Angeles City, Pampanga | 1,380 |
| Talavera, Nueva Ecija | 1,380 |
| Bolinao, Pangasinan | 1,364 |
| Parañaque, Metro Manila | 1,362 |
| Parañaque, Metro Manila | 1,350 |
| Luna, La Union | 1,348 |
| San Jose, Tarlac | 1,347 |
| Concepcion, Tarlac | 1,344 |
| San Fernando, Pampanga | 1,336 |
| San Fernando, Pampanga | 1,336 |
| Lucena City | 1,325 |
| San Fernando, Pampanga | 1,323 |
| San Fernando, Pampanga | 1,321 |
| Tarlac City | 1,320 |
| La Paz, Tarlac | 1,320 |
| Quezon City | 1,299 |
| Parañaque, Metro Manila | 1,296 |
| Villasis, Pangasinan | 1,292 |
| Tarlac City | 1,287 |
| Cebu City | 1,285 |
| San Fernando, Pampanga | 1,284 |
| Tarlac (140 kWp residence) | 1,267 |
| Tarlac City | 1,260 |
| Luisita, Tarlac | 1,260 |
| Concepcion, Tarlac | 1,249 |
| Mexico, Pampanga | 1,242 |
| Imus, Cavite | 1,239 |
| Magalang, Pampanga | 1,236 |
| Makati City | 1,235 |
| Tarlac City | 1,223 |
| Makati City | 1,220 |
| San Jose, Tarlac | 1,213 |
| Angeles City, Pampanga | 1,206 |
| Calamba, Laguna | 1,191 |
| Cabanatuan, Nueva Ecija | 1,180 |
| Imus, Cavite | 1,170 |
| Zaragoza, Nueva Ecija | 1,157 |
| Quezon City | 1,143 |
| Quezon City (years uncleaned) | 1,128 |
| Central Luzon | 1,021 |
| Concepcion, Tarlac | 1,065 |
| San Juan, Metro Manila | 1,058 |
| Bolinao, Pangasinan (many years uncleaned) | 965 |
Curtailed Systems (Excluded From All Averages Above)
| Type | Location | 2025 yield (kWh/kWp) |
|---|---|---|
| Manufacturing plant | Iloilo | 1,181 |
| Manufacturing plant | Imus, Cavite | 1,128 |
| Operations center | Rosario, Cavite | 1,052 |
| Operations center | Rosario, Cavite | 1,012 |
These four large systems averaged 1,093 kWh/kWp, and every one of them can generate more than it is permitted to deliver. Curtailment happens when a system must limit its export because of interconnection constraints or zero-export requirements. The output loss is real, it is invisible in a brochure, and it is a design and utility question that should be settled before a large system is signed, not discovered afterward. A significant number of Solaren’s largest installations are regularly curtailed and were excluded from this dataset entirely for that reason.
What the Distribution Tells You: Real P50 and P90
Financiers and engineers describe solar output using P50 and P90 probability estimates. P50 is the median outcome, the yield half of systems beat. P90 is the conservative planning figure, the yield nine systems out of ten exceed. Usually these come from simulation software. Ours come from meters:
- P50 (median): 1,299 kWh/kWp. Almost identical to the average of 1,298, which tells you the distribution is symmetric and honest, with no cluster of hidden failures dragging one tail.
- P90: 1,063 kWh/kWp. Nine out of ten systems in this dataset beat this figure in a below-average year.
- Best Decile: 1,569 kWh/kWp and above. More on what those systems have in common shortly.
If you are financing a project, those two numbers are the most useful sentences in this article. A Philippine system planned at a P90 of roughly 1,050 to 1,100 kWh/kWp, with upside to 1,300, is planning on evidence.
The Sun Hours Reality Check
Many quotations in this market are built on “peak sun hours,” typically 4 or even 5 hours per day. The arithmetic those assumptions imply:
| Assumption | Implied annual yield | Versus 99-system reality (1,298) |
|---|---|---|
| 5 sun hours | 1,825 kWh/kWp | Overstates by 41% |
| 4 sun hours | 1,460 kWh/kWp | Overstates by 12% |
| Measured 2025 reality | 1,298 kWh/kWp | 3.6 equivalent hours |
The 5-hour figure is not invented. Irradiance maps genuinely show the Philippines receiving 4.5 to 5.5 peak sun hours of raw sunlight. The problem is that raw sunlight is not electricity. Between the sun and your meter sit temperature losses, soiling, cable and inverter losses, degradation, shading, outages, and weather, and this dataset shows what survives all of them: about 3.6 hours.
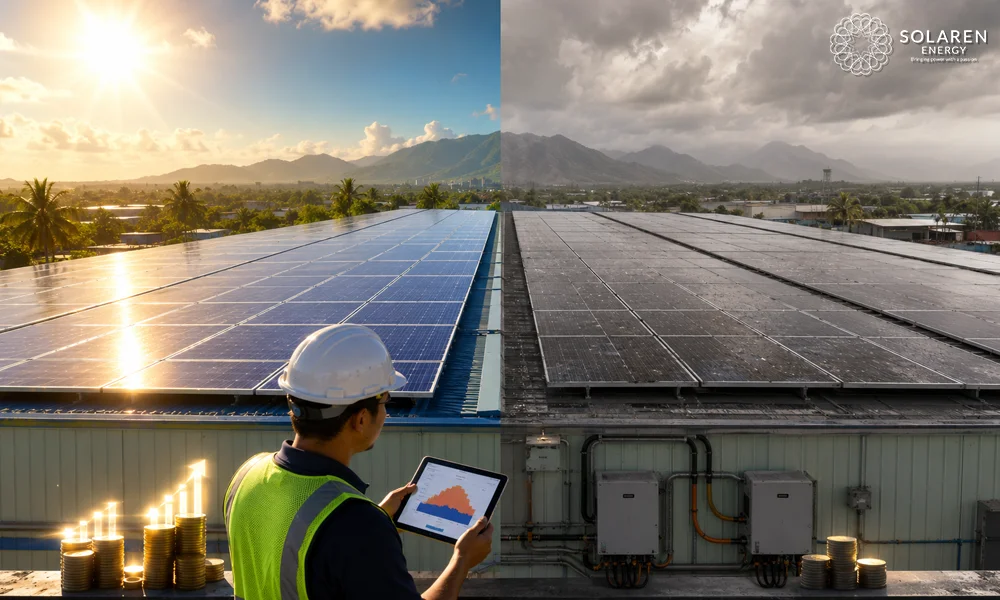
In money, the gap is not academic. On a 100 kWp commercial system at ₱12 per kWh, a 5-sun-hour proposal promises about ₱2.19 million in annual savings. The measured reality delivers about ₱1.56 million. That is over ₱630,000 per year of promised savings that will never arrive, on every 100 kWp, for 25 years. If a quotation in front of you assumes 5 sun hours, stretch its payback claim by 40 percent before you sign anything. If it assumes 4, add 12 percent. Or ask the installer to show you their measured fleet data. We just showed you ours.
One important qualifier that favors the buyer: this dataset includes systems up to twelve years old, with a decade of panel degradation baked in, and 2025 was a below-average irradiation year, with satellite data showing significantly reduced sunshine over Northern Luzon during the June-to-August habagat season. A new system with current high-efficiency bifacial modules should expect to begin its life above this fleet average. These figures are conservative by construction.
Why Real Systems Miss the Forecast: The Loss Stack
The gap between the map and the meter is not one loss; it is a stack, and the dataset lets us see several layers directly.
Soiling, and it is discovered, not specified: No engineering study before installation tells you your true soiling rate; the monitoring data tells you afterward. The starkest evidence in this dataset is a natural experiment: a hotel we clean routinely produced 1,483 kWh/kWp, while a college roughly a kilometer away, under the same sky all year and never cleaned, produced 1,017. Same sun. Same rain. A 46 percent difference, from cleaning alone.
The two uncleaned residences in the table (1,128 and 965) tell the same story at household scale, and the flour mill at 503 shows what industrial dust does to a system that also sat idle. Soiling is the cheapest problem in solar to fix and the most expensive to ignore.

Location within the same country: The twelve Metro Manila systems averaged 1,188 kWh/kWp against 1,322 for the 86 provincial systems, a ten percent urban discount driven by air pollution and building shading. If you are comparing a quote for a Makati rooftop against a provincial benchmark, adjust accordingly.
Shading that did not exist on installation day: One Makati office in the table was engineered correctly and performed correctly, until neighboring towers rose around it years later. It now yields 1,079. No forecast can model buildings that have not been built. In dense urban districts, this is a genuine long-term risk that deserves a line in any 25-year financial model.
Everything else the year throws: Brownouts force grid-tied systems offline for safety exactly when generation is available. Typhoon weeks produce near-zero output. Inverters clip, cables resist, panels run hot. Each loss is small; together they are the difference between 5 theoretical hours and 3.6 real ones.
And system quality within identical conditions: Seven farms in the single municipality of Sta Ignacia, Tarlac, under literally the same weather all year, ranged from 1,037 to 1,436 kWh/kWp. A 400 kWh/kWp spread with location fully controlled means design, orientation, and maintenance explain the difference, nothing else. Who engineers and maintains your system matters as much as where it is.
What the Best Systems Have in Common
The top decile of this dataset, everything at 1,569 kWh/kWp and above, shares a profile so consistent it reads as a recipe: provincial locations with clean air, unshaded roofs, and owners who clean their panels. Pangasinan, Cagayan, Nueva Ecija, and rural Tarlac dominate the list. Nothing exotic, no premium hardware tricks, just the loss stack systematically minimized. The ceiling for a well-kept provincial system in a normal-to-poor year is roughly 1,600 to 1,650 kWh/kWp, and that is a number you can hold a proposal against.
What This Means in Pesos: A Worked Example
Take a 100 kWp commercial rooftop, the size of a mid-sized factory or large retail store, at the measured average:
- Annual generation: about 129,800 kWh
- At a blended power cost of ₱12 per kWh: roughly ₱1.56 million per year in avoided electricity cost
- At the P90 planning figure: about ₱1.28 million per year, the number a conservative CFO should bank
- At the top-decile figure, a cleaned provincial system achieves: about ₱1.92 million
Those three numbers, floor, expectation, and ceiling, are a more honest financial frame than any single-point promise. What a system of this size costs to install, and how the payback arithmetic works from there, is covered in our guide to the real cost of solar panel installation, and the fundamentals of getting a system specified and built properly are in our solar panel installation pillar guide.
FAQ: Real Solar Panel Output in the Philippines

- What is the average solar panel output in the Philippines?
Across 99 Solaren-installed systems with complete 2025 data, the average was 1,298 kWh per kWp per year, with half of all systems between 1,200 and 1,400. The median was 1,299.
- How much electricity does a 100 kWp solar system produce in the Philippines?
About 129,800 kWh per year at the measured 2025 average, worth roughly ₱1.56 million annually at ₱12 per kWh. A conservative planning figure is about 106,000 kWh (the P90).
- How many peak sun hours does the Philippines really get?
Irradiance maps show 4.5 to 5.5 raw sun hours, but after real-world losses, measured systems delivered the equivalent of about 3.6 hours per day in 2025. Quotes built on 5 sun hours overstate output by around 40 percent.
- What is a good specific yield for solar in the Philippines?
Anything above 1,300 kWh/kWp is solid, above 1,450 is excellent, and 1,600+ is the realistic ceiling for a clean, unshaded provincial system. Persistent readings below 1,100 outside Metro Manila usually indicate soiling, shading, or a fault worth investigating.
- Why is my solar output lower than the installer promised?
The most common causes, in order: the quote assumed unrealistic sun hours, the panels need cleaning, new shading has appeared, or the system has an undiagnosed string fault. Monitoring data identifies which within minutes.
Conclusion

Real solar panel output in the Philippines, measured across 103 systems and a full and honestly poor year, is about 1,298 kWh per kWp: 3.6 genuine sun hours per day, not the 5 printed in optimistic proposals. That number carries twelve years of degradation on the oldest systems, a bad habagat, urban pollution, uncleaned roofs, and everything else 2025 could throw at 10.8 megawatts of hardware. It is the most honest benchmark we can offer, and we will republish it with a fresh year of data in the 2026 edition, including the recovery of the flour mill now cleaned and back in full operation.
If a proposal on your desk promises more than the numbers in these tables, ask the installer one question: show me your measured data. Solaren quotes against this dataset, and our project portfolio shows the systems behind it. If you want to know what your specific roof would realistically produce, contact us and we will model it against measured yields from comparable sites, with the assumptions shown.